How representative are country rankings?
The honest limits of ranking countries against US states: comparability grades, the measures we hide, data vintages, and what a median rank does and doesn't mean.
On this page
A ranking is a machine for making messy numbers look tidy. Feed in estimates with error bars, definitional quirks and mismatched years; out comes a crisp "14th of 51" that looks like a sports standing. The tidiness is the appeal — and the danger.
This site exists because we think rankings, done carefully, genuinely help people understand the world. But "done carefully" means being loud about what a rank can't tell you. This post is the complete list of ways our rankings are less certain than they look.
Every measure carries a comparability grade
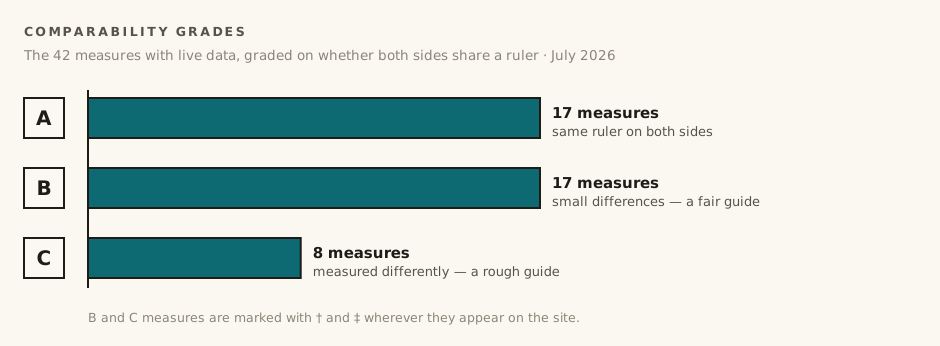
The central question for any country-vs-state comparison is: were the two sides measured the same way? We answer it per measure, in public, with a grade — the chart above shows how the measures carrying data grade out at the July 2026 refresh.
- A — same ruler on both sides. Example: unemployment, where state and country figures both follow the International Labour Organization's survey definition of who counts as unemployed.
- B — small differences; the rank is a fair guide. Example: GDP per capita, where states are price-adjusted by one federal program (BEA regional price parities) and countries by a different international one (World Bank PPP).
- C — measured differently enough that ranks are rough guides. Example: obesity, where US states self-report height and weight in a telephone survey (people flatter themselves) while country figures are measured or modelled — so state ranks flatter the states.
The grade and its plain-English caveat appear wherever the measure is used, and all of them live on the sources page. If you only adopt one habit from this post: before quoting a rank, check its letter.
The measures you don't see at all
Some absences on this site are deliberate. A rule in our ranking code refuses to show a measure unless enough peers have data — at least 41 of the 51 US states, at least 25 countries for Europe-wide ranks, at least 100 for world ranks. The comment in the code says why: a "1st of 3" would be a lie of omission.
An empty slot is a finding. It means no honest number exists yet, and we would rather show you nothing than something we made up.
Where the blanks are right now
- Happiness in state rankings — the Gallup life-evaluation ladder behind the World Happiness Report isn't published per US state, so countries can't be ranked against states on it at all.
- Pupil performance for states — PISA and America's NAEP are different tests, and no defensible published method links their scales, so we show country PISA scores for the 81 participating countries and economies and leave states out rather than invent a conversion. The PISA 2022 Technical Report runs to hundreds of pages on how that scale is built — which is exactly why we won't freehand a bridge onto it.
- Median income for states — country figures are wired up; the matching state series is still pending.
Fresh data and frozen data
Most of our sources have official APIs, and a weekly job re-pulls them automatically — revisions upstream flow through within days. But some datasets are deliberately pinned: fixed files from a specific edition of a source, updated only when we review them. PISA 2022 stays until the next PISA cycle publishes. The Yale environmental index updates every two years. Our country gun-deaths figures are pinned to the 2019 Global Burden of Disease study, the newest openly available complete table.
The sources page marks every source as "refreshed weekly" or "updated per edition", with the date it was last touched. The full story of why freezing data can be the honest choice is in its own post.
The years don't always match
Even a grade-A measure can compare a 2021 number with a 2024 number. Statistical agencies publish on different lags: our state life expectancy figures are from 2021 while country figures reach 2024; for road deaths it's reversed — states have recent data, the comparable WHO country set is older.
For slow-moving quantities this matters little. But it is real, it is visible (every value on the site carries its year), and for anything that shifted sharply in recent years — traffic patterns, for instance — it is worth a second look before quoting.
What a median rank actually means
Each country and state page shows one headline number: a median rank — "median 12th of 51", say. Here is precisely what that is: we rank the place on every measure that has enough data, list those ranks, and take the middle one (for an even count, the two middle ranks are averaged). Purely descriptive measures with no better-or-worse direction, like population and land area, are excluded.
What it is not
- Not a score. Nothing is weighted. Life expectancy counts exactly as much as paid vacation days.
- Not computed on identical inputs for everyone. Places differ in which measures have data, so two medians may summarize different sets of rows.
- Not stable to composition. Add a measure a place does well on, and its median can improve with no change in the real world.
A median rank is a table of contents, not a verdict. It tells you whether the detailed rows are worth your scroll — then the rows, with their grades, years and sources, are the actual finding.
How to read this site like a skeptic
- Check the grade (A, B or C) and read its caveat.
- Check the year next to each value, especially when a rank surprises you.
- Treat small gaps as ties — a couple of ranking places is usually noise.
- Click the source link and see the number for yourself; every row has one.
We can't make international statistics more certain than they are. What we can do is refuse to hide the uncertainty — and give you everything needed to check our work.
Sources & further reading
- World Bank — World Development Indicators — the harmonized country series behind several of our measures, and the model of publishing definitions next to data.
- OECD — PISA 2022 Technical Report — how the international student assessment is built; the scale US school tests can't be defensibly converted onto.
- World Happiness Report — the Gallup life-evaluation ladder behind our happiness measure — published for countries, not for US states.
- Bureau of Economic Analysis — Regional Price Parities — the state-side price adjustment that makes GDP per capita a grade-B, not grade-A, comparison.
- CDC — Behavioral Risk Factor Surveillance System (BRFSS) — the telephone survey behind state obesity figures — the definitional mismatch that earns that measure a C.
- WHO — International Classification of Diseases (ICD) — the cause-of-death coding standard that lets death-based measures share one ruler.
Every dataset behind the numbers in this post is also listed, with its retrieval date and comparability grade, on the sources page.
Frequently asked questions
What do the A/B/C comparability grades mean?
A means both sides were measured the same way (unemployment, where states and countries follow the same ILO survey definition). B means small differences that leave the rank a fair guide (GDP per capita, price-adjusted by two different programs). C means the two sides were measured differently enough that ranks are rough guides (obesity, where states self-report in a telephone survey while country figures are measured or modelled).
Why are some measures missing for some countries or states?
Blanks are deliberate. A measure is hidden unless enough peers have data — at least 41 of the 51 US states, 25 countries for Europe-wide ranks, 100 for world ranks — because a "1st of 3" would be a lie of omission. An empty slot means no honest number exists yet.
What does a median rank mean on this site?
The place is ranked on every measure with enough data, those ranks are listed, and the middle one is taken (averaging the two middle ranks for an even count). Purely descriptive measures like population are excluded. Nothing is weighted, so it is a table of contents for the detailed rows, not a score.
Do the data years always match between states and countries?
No. Statistical agencies publish on different lags — state life expectancy figures are from 2021 while country figures reach 2024, and road deaths run the other way. Every value on the site carries its year, and it deserves a look whenever a rank surprises you.