WHO, UNODC, and the problem of counting deaths
Police statistics and death certificates count the same tragedies differently. Why we rank homicide, suicide and overdoses on vital registration — not crime reports.
On this page
How many people were murdered in the United States last year? There are two official answers, and they don't match. The FBI publishes one number, built from what police departments report. The CDC publishes another, built from death certificates. Both are "official US government data" — and they can differ by hundreds of deaths, because they are counting different things.
Every death statistic on Ranking Countries — homicide, suicide, drug deaths, road deaths, infant mortality — sits on top of a choice like this. Here is how we choose, and why.
Two ways to count a homicide
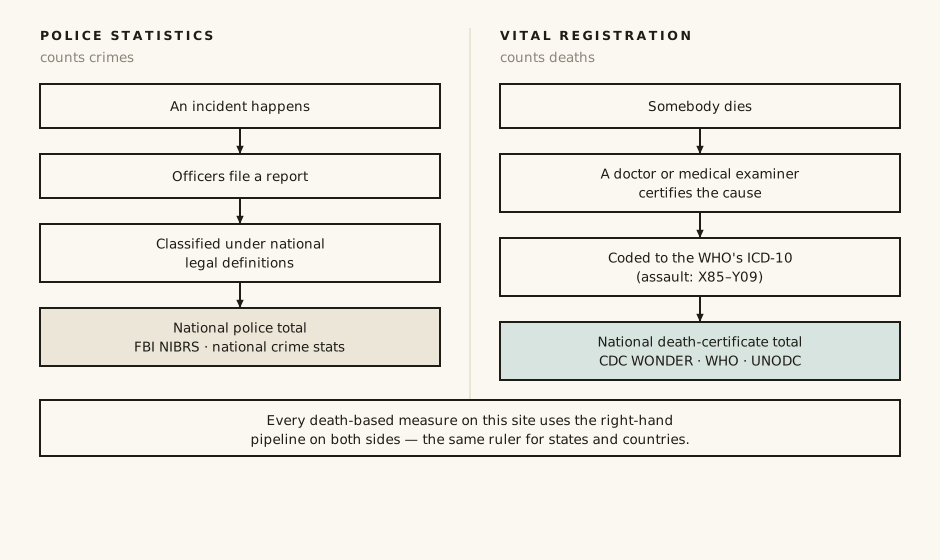
Police statistics count crimes. An incident happens, officers file a report, the report gets classified under that country's legal definitions, and the national total is the sum of what every police agency sent in. This is what most people imagine "the murder rate" is.
Vital registration counts deaths. Somebody dies, a doctor or medical examiner certifies why, and the cause is coded using the WHO's international classification of diseases — the ICD. A death from assault gets an ICD-10 code in the range X85–Y09, no matter what any court later decides. The national total is the sum of death certificates.
These systems disagree for boring, structural reasons. Police data depends on every agency actually reporting, on legal definitions ("murder" vs "manslaughter" vs "justifiable homicide"), and on what happens after the initial report. Death certificates depend on medical certification quality, but they have one enormous advantage: in rich countries, essentially every death gets one.
Why our US homicide numbers come from the CDC, not the FBI
International homicide figures — the UNODC and WHO series we use for countries — rest on the vital-registration tradition. So for US states, we deliberately use CDC mortality data (assault deaths, ICD-10 X85–Y09) instead of FBI crime statistics.
The FBI's numbers have a specific problem right now: the transition to its new reporting system, NIBRS, which became the only collection route in January 2021, left coverage gaps — in recent years a meaningful share of police agencies simply didn't report, and their crimes had to be estimated or left out. Death certificates don't have that gap. And just as importantly, using cause-of-death coding on both sides means a US state and a European country are being measured with the same ruler.
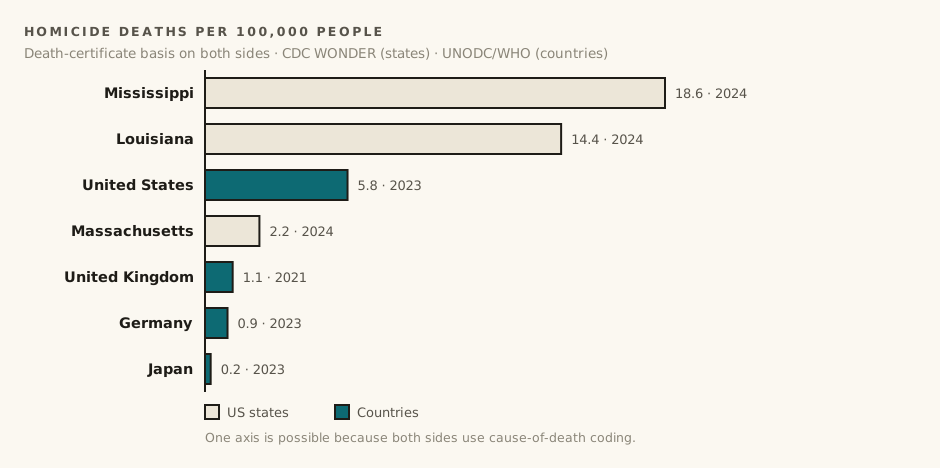
That ruler shows real differences. In our current data, the US rate is 5.8 homicide deaths per 100,000 people (2023). The UK is at 1.1, Germany at 0.9, Japan at 0.2. And the US states span an enormous range by themselves: Massachusetts at 2.2 against Mississippi at 18.6 (2024). Whatever ranking you build, the definitional choice shouldn't be the thing driving it.
Where death certificates struggle
Vital registration is the best system available, not a perfect one.
Completeness varies by country. Rich countries register essentially every death; elsewhere, registration can be partial and figures partly modelled. That is one reason several of our death-based measures carry a comparability grade of B rather than A on the sources page.
Suicide is the hardest case. Certifying a death as suicide involves judgment, and in some places stigma or legal consequences push deaths into "undetermined" categories. On top of that, the WHO's country figures are age-standardized while US state figures follow the US national vital statistics conventions. The direction of comparisons is sound; the second decimal place is not.
Drug deaths: when measuring better makes you look worse
Our starkest example is drug overdoses. The US codes overdose deaths more completely than almost anywhere in the world — forensic toxicology is routine, coroners look for drugs, and the CDC publishes provisional overdose counts monthly, about four months after death. Many countries' systems catch far fewer, far later.
So when our data shows Portugal at 1.8 drug deaths per 100,000 and West Virginia at 37.9, part of that gap is a genuine, catastrophic difference — and part is that the US is simply better at noticing. This is why drug deaths carry our lowest comparability grade, C, with the caveat printed right on the ranking. It is also a measure where data is scarce and slow: only 87 places have usable figures at all, and the UK's most recent country-level figure in our dataset is from 2018.
A number that makes you look worse because you measure honestly is still a good number. But ranking it against countries that measure less well requires a warning label, so we attach one.
Even the small conventions matter
Road deaths sound simple to count — and then you have to decide when a death counts. Die at the scene? Clearly. Die of injuries three weeks later? The convention used in international comparisons, including the WHO's road safety reporting, is that a road death is one occurring within 30 days of the crash. The US system we use (NHTSA's FARS census of fatal crashes) applies the same 30-day rule, which is precisely why we can put states and countries on one axis.
Infant mortality has its own version: countries differ slightly in how they register deaths at the very edge of viability, which nudges figures at the margins.
The rule we follow
Match definitions first, compare second. Where the definitions align, we say so (grade A). Where they mostly align, we grade B and explain the difference. Where they genuinely differ — drug deaths, obesity, a few others — we grade C and tell you to treat the rank as a rough guide. The one thing we never do is quietly mix a police statistic into a death-certificate ranking because it was easier to download.
Sources & further reading
- WHO — International Classification of Diseases (ICD) — the coding standard for causes of death; assault deaths fall in ICD-10 codes X85–Y09 regardless of what courts later decide.
- UNODC — Intentional homicide victims (dataUNODC) — the international homicide series we use for countries.
- CDC WONDER — mortality databases — US death-certificate data by cause, the basis of our state homicide, suicide and drug-death figures.
- FBI — National Incident-Based Reporting System (NIBRS) — the crime-report system the FBI moved to in January 2021 — the transition left gaps in agency coverage.
- CDC — Provisional drug overdose death counts (VSRR) — monthly provisional overdose data published about four months after death — why US state figures are years fresher than most countries'.
- NHTSA — Fatality Analysis Reporting System (FARS) — the US census of fatal crashes, which counts deaths occurring within 30 days of the crash — the same convention international road-death figures use.
- WHO — Global status report on road safety 2023 — the WHO's comparable country road-safety assessment.
Every dataset behind the numbers in this post is also listed, with its retrieval date and comparability grade, on the sources page.
Frequently asked questions
Why do the FBI and CDC report different homicide numbers?
They count different things. The FBI counts crimes: incidents classified by police agencies under legal definitions. The CDC counts deaths: death certificates coded to the WHO's ICD-10 standard (assault deaths are codes X85–Y09). The two systems can differ by hundreds of deaths in a year for structural reasons, not error.
Why does Ranking Countries use CDC data instead of FBI data for state homicide?
Two reasons. The FBI's transition to NIBRS reporting in January 2021 left coverage gaps — a meaningful share of police agencies simply didn't report in recent years. And international homicide series from UNODC and WHO rest on vital registration, so using cause-of-death coding on both sides means states and countries are measured with the same ruler.
Are US drug-death figures comparable with other countries?
Only roughly — which is why drug deaths carry the site's lowest comparability grade, C. The US codes overdose deaths more completely than almost anywhere: forensic toxicology is routine and the CDC publishes provisional counts monthly. When the data shows Portugal at 1.8 drug deaths per 100,000 and West Virginia at 37.9, part of the gap is real and part is that the US is better at noticing.
What counts as a road death in these statistics?
A death occurring within 30 days of the crash — the convention used in international comparisons including the WHO's road-safety reporting. The US system behind our state figures, NHTSA's FARS, applies the same 30-day rule, which is what lets states and countries share one axis.